


How the ESG Analyst Should Think – From Climate Change Scenarios to ESG* Risk Materiality
Or Brace for Physical Climate Changes!
ESG risk materiality – A dynamic and complex perspective
Understanding ESG risk materiality requires knowledge of the typical ESG risks for activities often grouped in industries and sectors. Unlike traditional financial risks, rooted in historical data and stable trends, ESG risks are less stable in structure and significantly influenced by global megatrends, stakeholder reactions and regulatory landscapes.
As different climate scenarios include different mixes of risk types and potential costs for companies, the chosen scenario will influence on the risk materiality. Understanding climate change scenarios hold the key to predicting how the materiality of some ESG risks may change now and over time. The uncertainty surrounding these scenarios makes it imperative for ESG risk analysts to adopt a forward-looking and adaptive climate scenario framework and to follow the climate change events tightly as they unfold.
Climate change risk is part of environmental risks that are part of ESG risks. In the following, we will try to model this for purely illustrative purposes without any ambition to model this correctly, the target is only to serve as a base for reflection. But first let’s have a closer look at some climate scenario references.
Some climate change scenarios – IPCC
The Intergovernmental Panel on Climate Change (IPCC) outlines a range of Representative Concentration Pathways (RCPs) to model potential climate futures. Two scenarios on each side of the scale, RCP 2.6 and RCP 8.5, highlight a spectrum of outcomes based on varying levels of global preventive responses, greenhouse gas (GHG) emissions and physical climate change severity.
Shorter term – Transitional climate change costs
- RCP 2.6: This pathway assumes aggressive global action to limit temperature rise to below 2°C. Regulatory measures are expected to tighten considerably, leading to elevated costs for GHG emissions, pollution, and other environmental adverse impacts. Companies operating in high-impact industries could face prohibitive restrictions, rendering some activities unprofitable or outright banned.
- RCP 8.5: In this high-emission scenario, minimal regulatory intervention allows business-as-usual practices to continue. The lack of immediate costs tied to emissions and environmental degradation might appear advantageous in the short term.
Longer term – Physical climate change costs
- RCP 2.6: While physical climate risks are mitigated by successful interventions, residual risks such as localized extreme weather events and gradual environmental changes persist. Companies will need to adapt to new norms, but the magnitude of adaptation required is relatively contained.
- RCP 8.5: Severe and widespread physical climate risks dominate. Rising sea levels, intensifying storms, precipitation intensity, and extreme temperature variations create existential threats to infrastructure, supply chains, and communities. The associated costs, from disaster recovery to insurance, become staggering, posing existential challenges to many industries.
Hereunder, we have tried to model the two main cost components of different scenarios. It is only meant as illustrative to showcase our reasoning and not to estimate real cost levels. It is meant to serve as a base for reflection only.
Figure 1 – Climate change related costs – % proportion of types per scenario
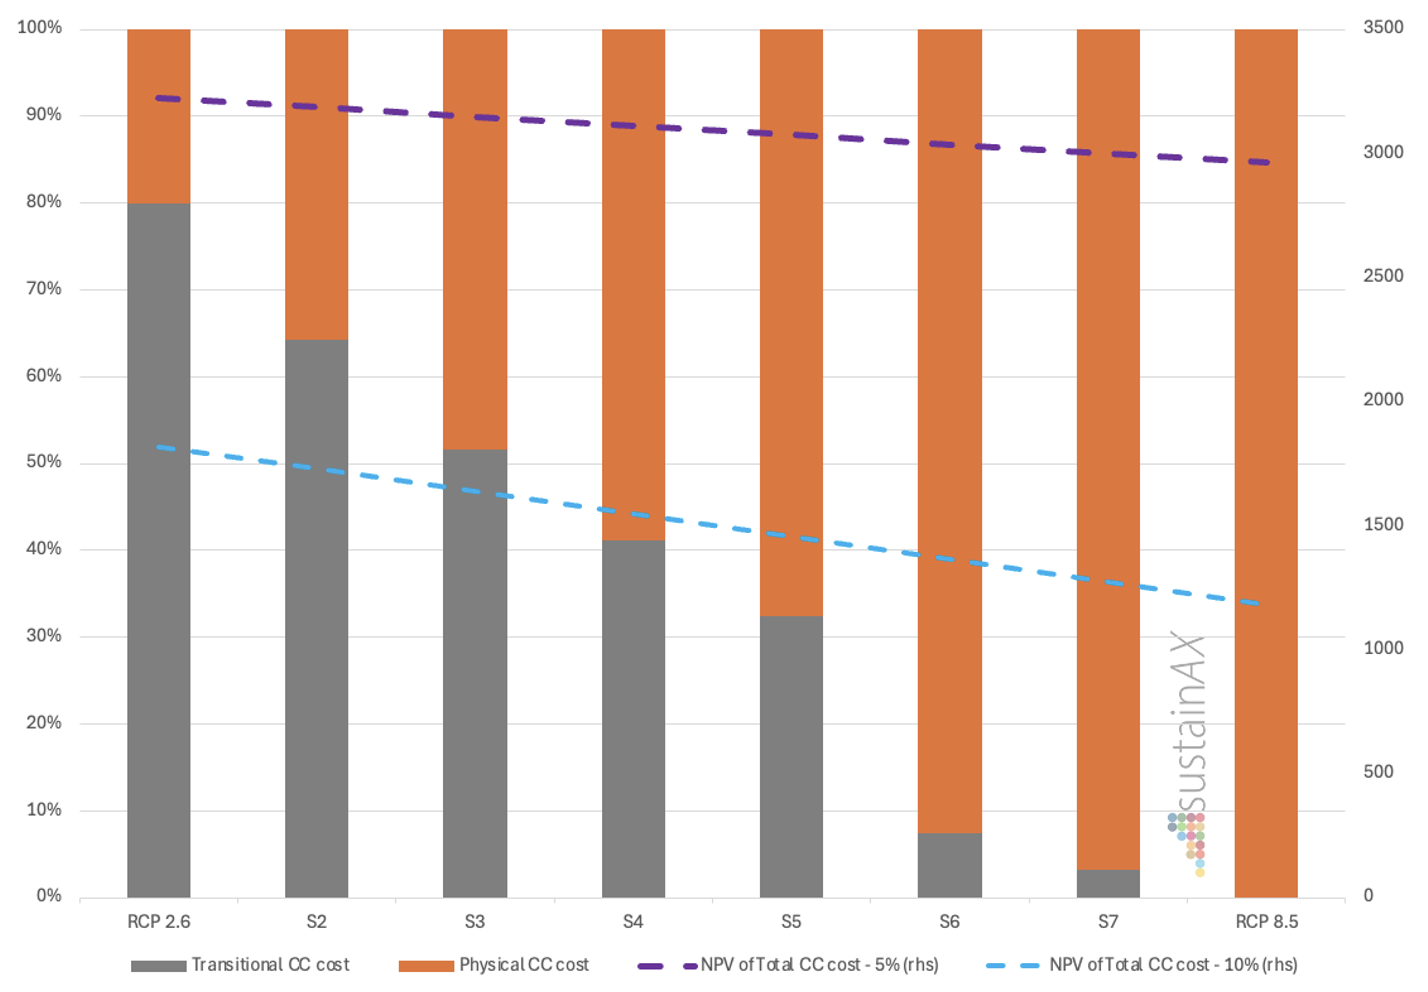
Source: sustainAX, February 2025, the NPV numbers are from the following RCP 2.6 and RCP 8.5 examples, levels in-between are only represented by the line between these two points.
The time horison aspect
What Figure 1 does not show is the difference in time horison for the two types of climate change related costs; transitional and physical. And this is very important to understand why many companies do not do more to reduce their adverse impact on the environmental with target to reduce their own burden from future climate change related harse physical environments.
Climate change risk mitigation efforts
As companies understand the climate change risks they are exposed to, they will start profitable ESG risk mitigation. This is reduction of ESG risks that costs less than the value of the estimated returns that can be lower costs, higher revenues and/or lower risk. Read more about profitable ESG risk mitigation here: https://www.sustainax.com/index.php/2025/01/17/esg-back-to-reality-2-only-profitable-esg-risk-mitigation-works/
The risk mitigation can be reducing adverse environmental impacts and that may reduce regulatory driven costs and negative client behavioural changes for instance. It can also be investing in resilience to prepare for the coming physical climate change and the costly outcomes it may bring.
ESG risk mitigation costing more than the estimated returns it creates will not happen and only the right understanding of a company’s ESG risks can lead to the right decisions. There is quite some work left to do for most companies here.
Figure 2 – Climate change related costs – % proportion of types per scenario
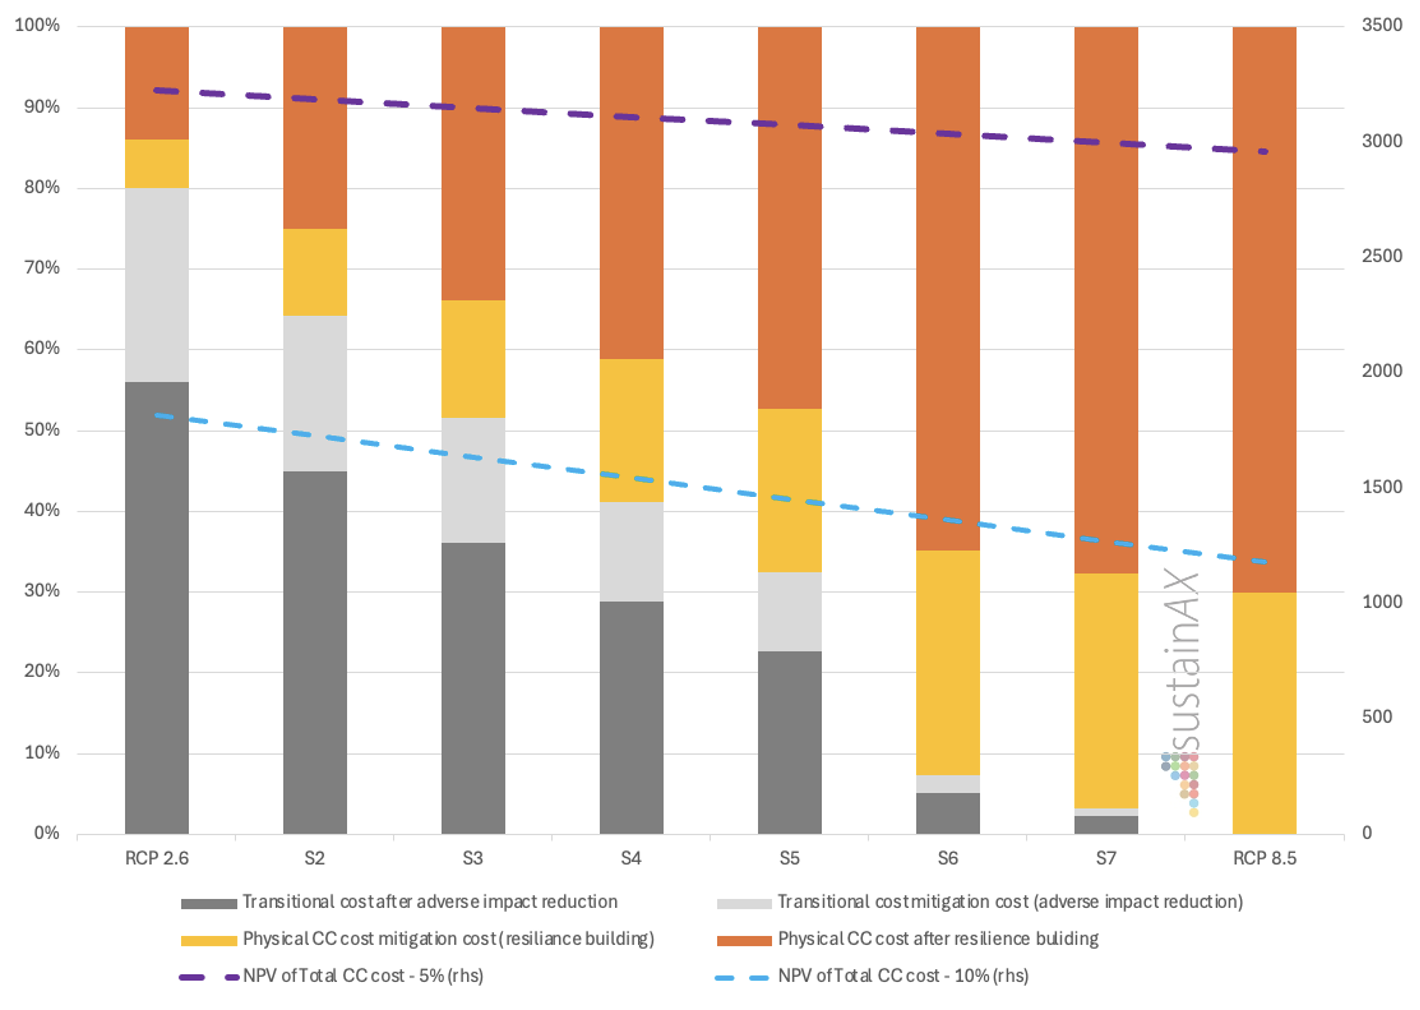
Source: sustainAX, February 2025, the NPV numbers are from the following RCP 2.6 and RCP 8.5 examples, levels in-between are only represented by the line between these two points.
In the Figure 2 here above we simplistically try to show how mitigation action costs are reducing the costs of transitional and physical climate risks. We have simply presumed that the ESG risk mitigation cost is the same as the reduced cost from transitional and physical climate risks, respectively. In real life we would expect the mitigation cost to be less than the climate change cost change, this because the efforts will stop as soon as the initiatives start to cost more than the estimated gains. For the NPV we have simplistically also presumed that the mitigation costs are taken at the same time as the estimated resulting returns occur.
ESG risk materiality in different climate scenarios
To capture the time horizon differences for the different cost component, we now turn to single scenarios for our simple illustrative modelling.
Simple illustrative modelling
In the following we have tried to make some simple modelling, only to serve as base for reflection on mechanisms and without any intention to estimate the right sizes.
Some conditions:
- We presume the NPV terminal value is integrated in the modelled periods for simplification reasons.
- We have presumed linear development over time both for transitional cc costs and physical cc costs, falling for the first and rising for the latter, with an exception for the “inevitable political response” case. Falling transitional costs is reflecting companies’ adaptation. This can surely be debated, and we have done this for simplification reasons.
- We have looked at 5% and 10% discount rates, that can of course be debated.
Figure 3 – Illustration model parameters – Cost levels and interest rates
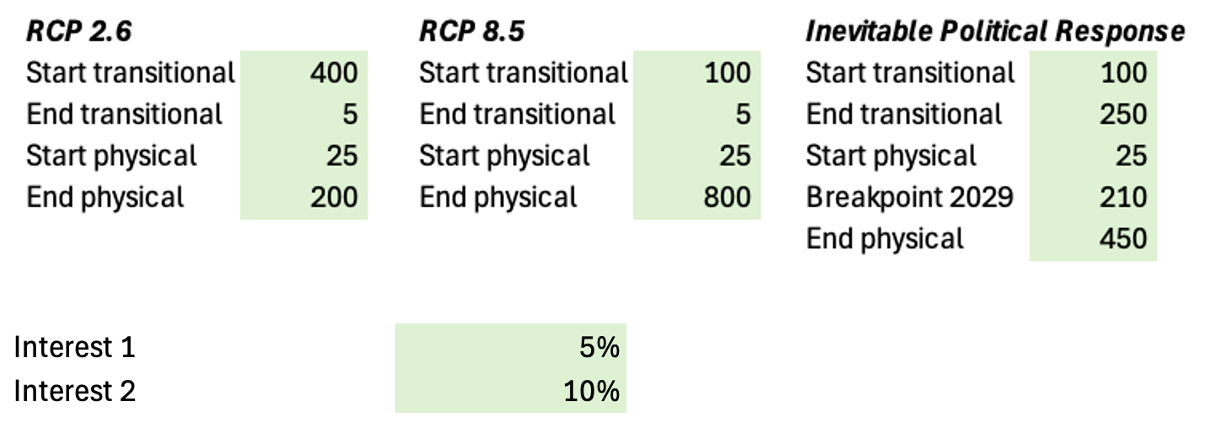
Source: sustainAX, February 2025
For the different scenarios, we have applied the parameters as can be seen in the figure 3 above.
They are as right as they are wrong, and here each reader likely has their own opinions.
RCP 2.6: The regulatory-driven pathway
Under RCP 2.6, ESG risk materiality on the environmental side is shaped predominantly by transitional risks. Regulatory tightening makes environmental harm—including GHG emissions and pollution—expensive. Hereunder comes increasing insurance premiums and also non-insurability as insurance companies look into the climate change future. Climate change related consumer behaviour changes also come in here.
Companies unprepared for this shift may face eroded profitability and stranded assets. However, organizations investing in sustainable practices, innovative technologies, and efficient resource use can gain a competitive edge. This scenario underscores the importance of forward-thinking strategies to align with evolving policies and stakeholder expectations.
ESG risk mitigation examples:
- Programs for reduction of GHG intensity in production and in the supply chain
- Programs for reduction of hazardous waste in production and in the supply chain
- Installation of environmental management systems to ensure planned for changes actually happen
- Increasing production waste recycling (less landfill)
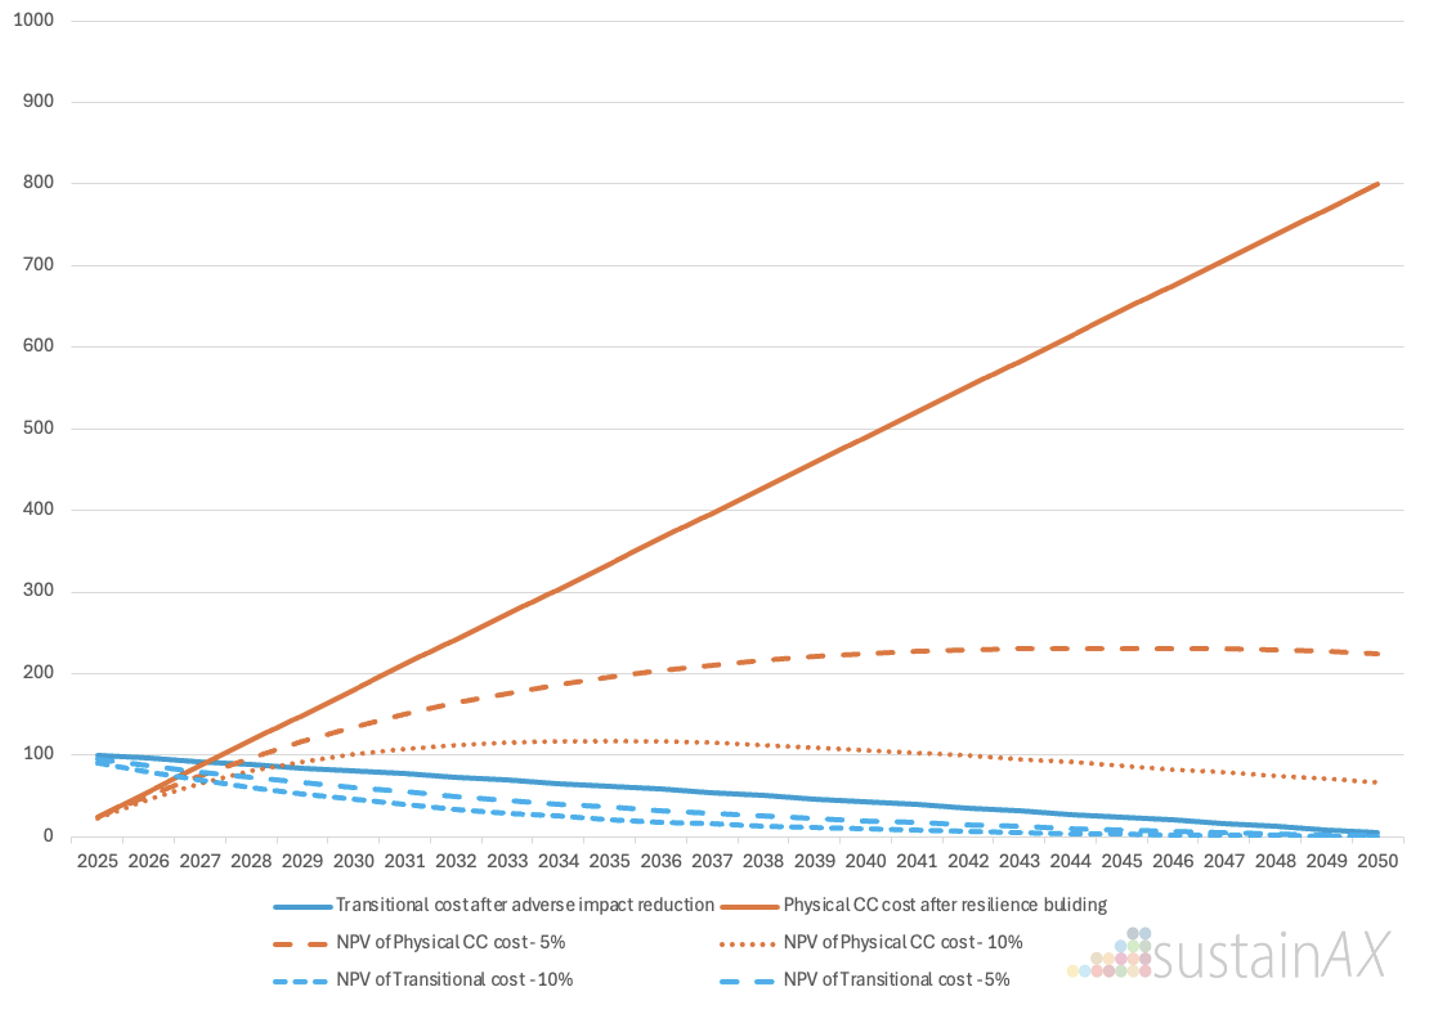
Figure 4 – Climate change related costs – RCP 2.6
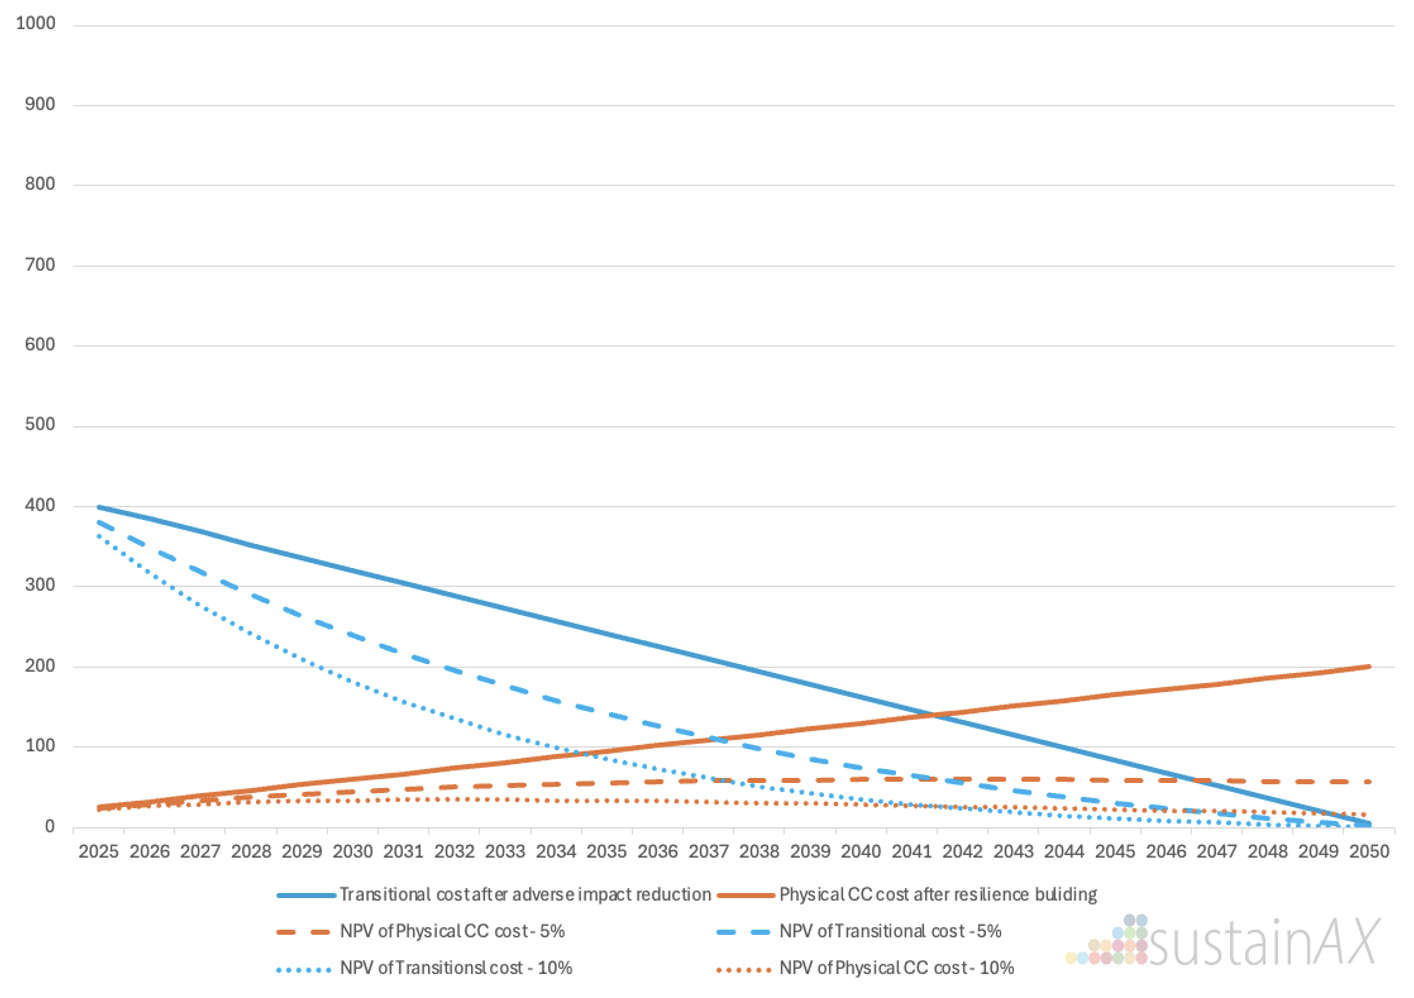
Source: sustainAX, February 2025
As can be seen in Figure 4 here above, despite heavy regulatory and other transitional costs close in time, there will still be physical climate change costs.
RCP 8.5: The physical-risk-driven pathway
In RCP 8.5, the absence of robust regulatory measures or other transitional changes leads to extreme physical climate events in the longer run. ESG risk materiality becomes overwhelmingly dominated by the direct and indirect impacts of these events. Companies face escalating costs for repairs, insurance, and climate resilience. Supply chain disruptions, workforce displacement, and community instability exacerbate vulnerabilities. For industries reliant on natural resources, the consequences can be particularly dire, with resource scarcity and ecosystem collapse adding to operational uncertainties.
ESG risk mitigation examples:
- Programs for reducing exposure to real estate portfolios close to the shore
- Programs for reinforcing resilience to potential landslide
- Programs for preparing alternative suppliers or raw materials for nature dependent supply chains
- Programs for making alternative products to compensate for a likely disrupted supply chain
- Programs to reduce credit portfolio exposure to the agricultural sector
Figure 5 – Climate change related costs – S8 – RCP 8.5
Source: sustainAX, February 2025
As can be seen in Figure 5 here above, due to light regulatory and other transitional action close in time, there will be severe physical climate change costs further out in time.
The Inevitable political response case
The inevitable political response is what practitioners expect will happen as climate change events play out. It can also be triggered when authorities see that despite extended sustainability reporting, the companies do not reduce their adverse environmental impacts like GHG emission intensity. It is partly driven by (justified) panic and can be quick and brutal.
Figure 6 – Climate change related costs – Inevitable political response
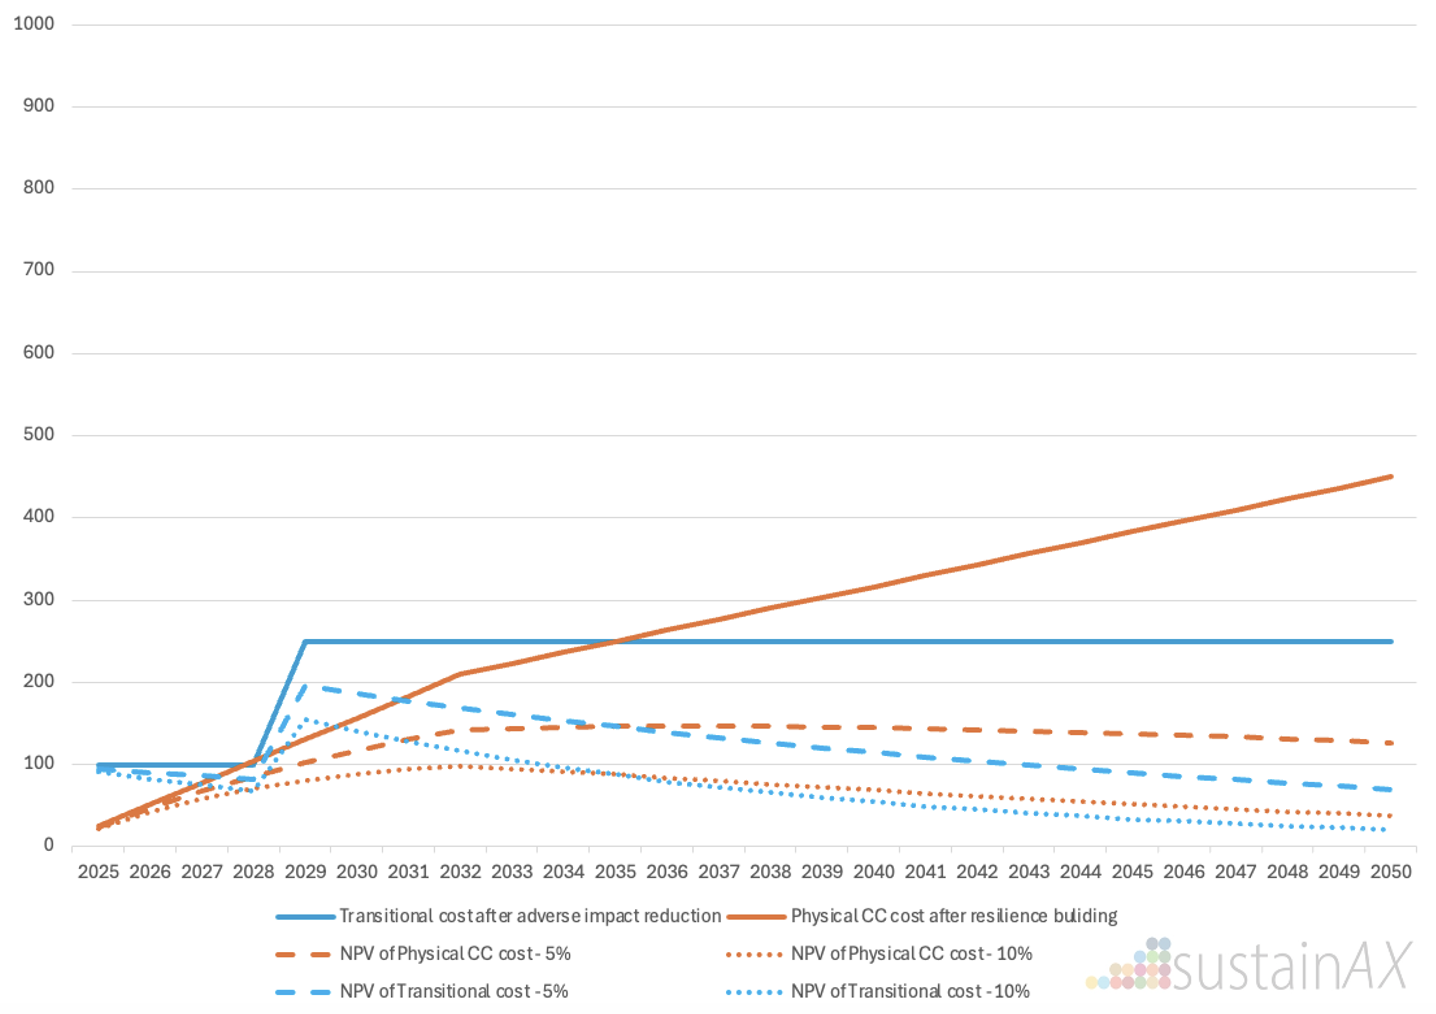
Source: sustainAX, February 2025
As can be seen in the Figure 6, due to rapid changes in physical cc events, political decisions are taken to quickly curb companies’ adverse environmental impacts. As this is some kind of “panic” state, we have kept the transitional cc costs flat reflecting a steadily increasing regulatory driven costs despite companies’ adaptation.
Discounting reduces the “consideration” today for physical climate change risk
In an attempt to highlight the importance of the time differences for transitional and physical cc related costs we have calculated the NPV for the 3 discussed scenarios with 5% and 10% interest rates as can be seen in the Figure 7 and 8 below.
Figure 7 – NVP at 5% discount rate for different scenarios
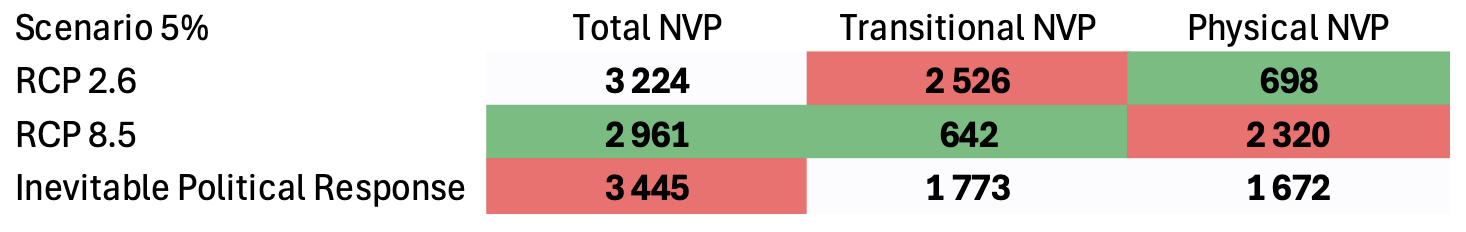
Source: sustainAX, February 2025
Figure 8 – NVP at 10% discount rate for different scenarios
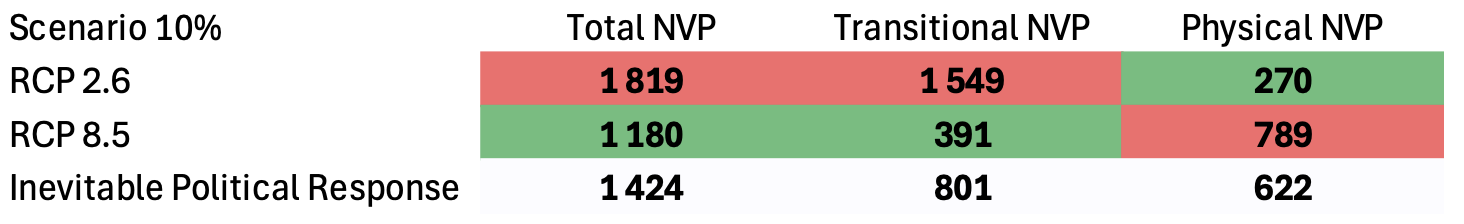
Source: sustainAX, February 2025
Considering the NPV of the 3 scenarios, we see:
- On both discount rate cases above we see that the cost of the RCP 2.6 is higher than the 8.5 as physical climate change costs are further out in time. A dangerous fact here is that companies for this reason may not themselves act to address their own impact on the climate change.
- What about companies not understanding the potential costs of physical climate change? They will in their modelling have even lower future physical CC costs and the NPV of these will be even lower. Understanding the risks a company is exposed to is important.
In our illustration case the NPV of RCP 8.5 is lower than the RCP 2.6, hence companies will lobby for less regulation and do very little effective volunteer costly efforts to reduce their environmental adverse impact. Of course, playing with the numbers in this simplistic model can change this a lot.
If you would like us to send you the Excel file (see figure 9a and 9b) so you can model this yourself with your own numbers, let us know by sharing the LinkedIn post including your thoughts about the theme of the article.
We played with much worse physical cc cost outcomes in the example below and all of a sudden the RCP 2.6 has the lowest NPV.
Figure 9a – Excel model – Input parameters
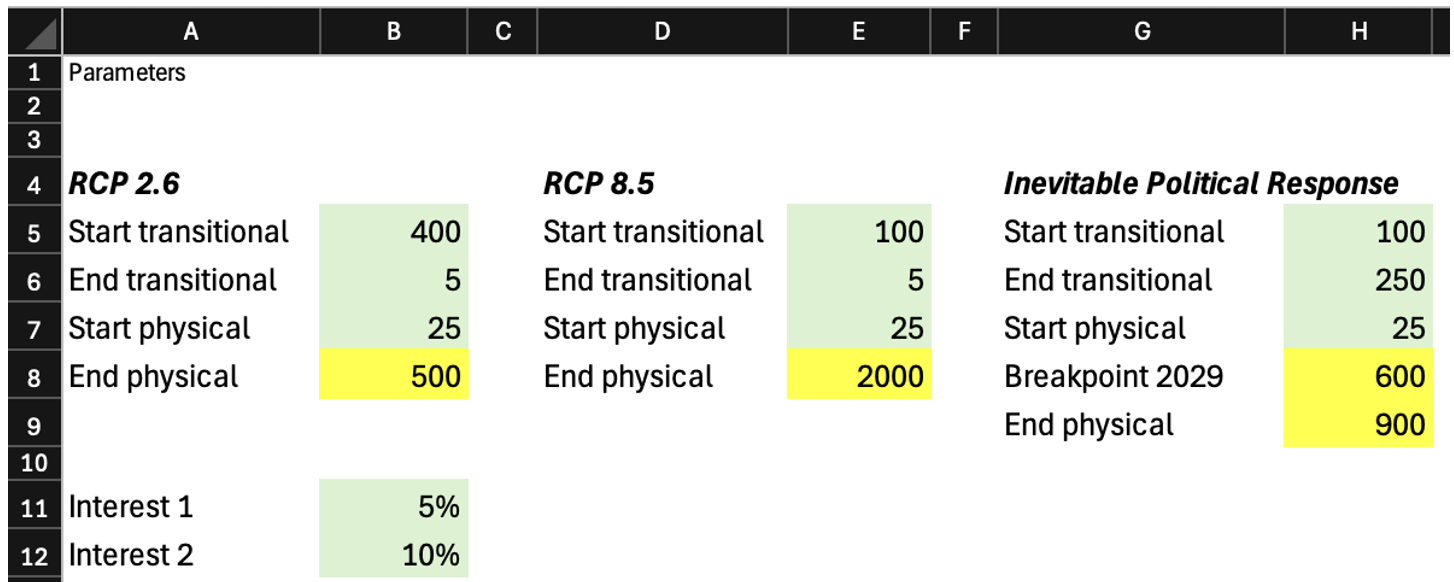
Source: sustainAX, February 2025
Figure 9b – Excel model – Graphs
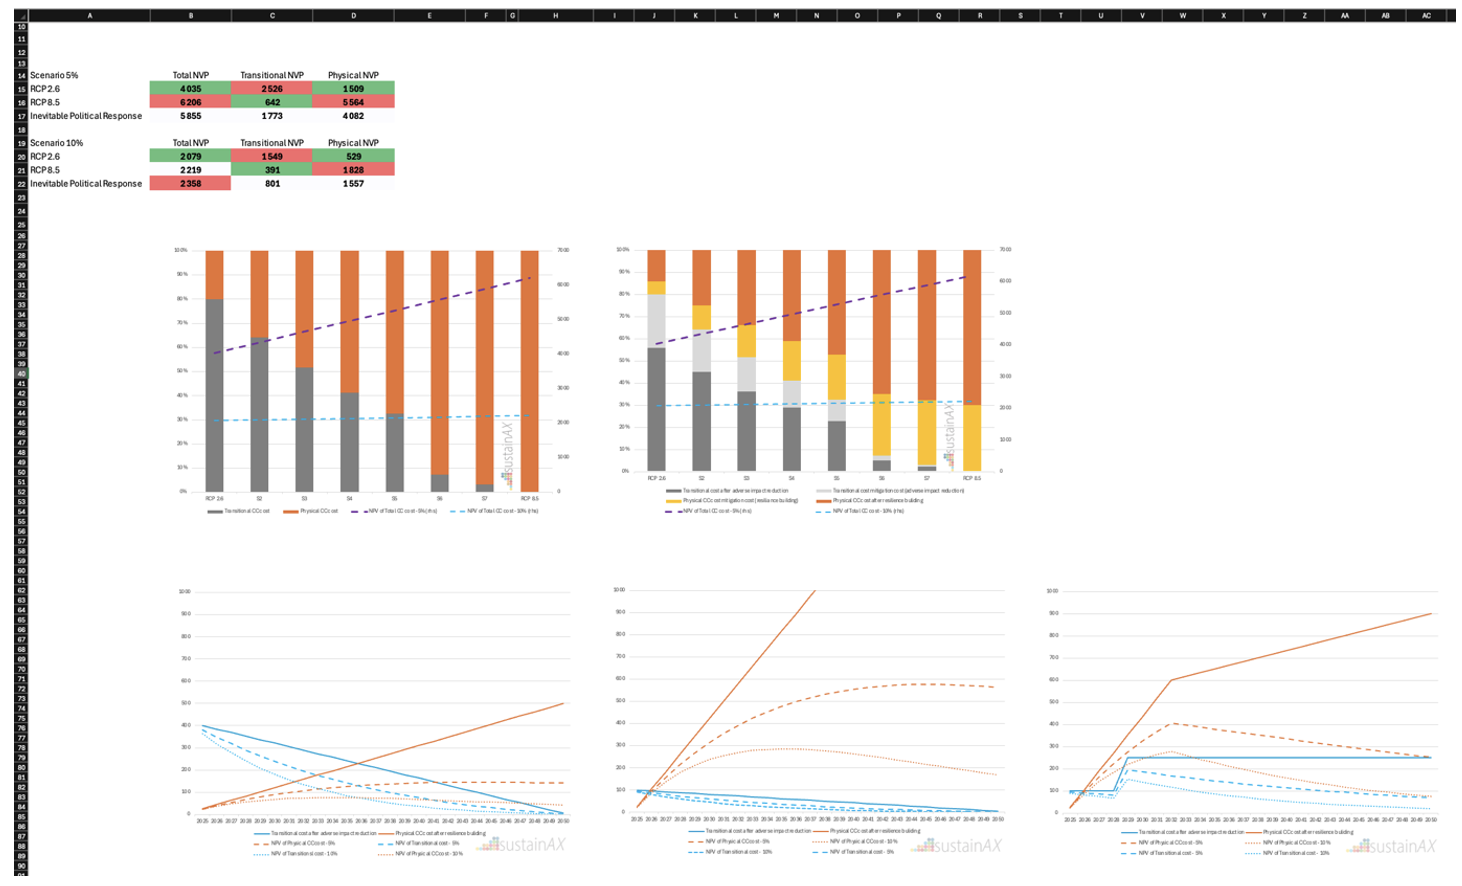
Source: sustainAX, February 2025
The likely climate change scenario as seen now?
Given the current trajectory of emissions and international responses, the most optimistic scenarios, such as RCP 2.6, are increasingly unlikely. As seen, the IPCC’s expected scenarios suggest a mix of transitional and physical risks, but with very different outcomes.
The IEA’s World Energy Outlook tracks progress in the energy sector, indicating that current energy policies and practices are leading to a trajectory closer to the IPCC SSP2-4.5 or SSP3-7.0 scenarios unless significant policy changes occur, where:
- IPCC SSP2-4.5: An intermediate scenario with moderate emissions, leading to a projected warming of approximately 2.7°C by 2100.
- IPCC SSP3-7.0: A high-emission scenario resulting in significant warming, potentially around 3.6°C by 2100.
This is the equivalent to a place between IPCCs RCP 2.6 and RCP 4.5.
Recent political trends and changes pointing to worse scenarios
With the USA leaving the Paris agreements and going for “drill, baby drill” in addition to all other negative development of fossil fuel use on a global scale, we are likely moving out on the scale even further away from RCP 2.6. As time goes by, more severe IPCC cc scenarios are more probable, and the political inevitable responses get closer as aven climate deniers will wake up when it starts to hurt.
Recently we have seen changed attitude in Europe also after the Draghi report leading to the EU Competitiveness Compass. We are now awaiting the Omnibus regulation targeting to take down ambitions for sustainability reporting due to among other elements the suffering of SMEs from regulatory reporting burden. Will this over time push us even further out on IPCCs scenario scale?
Call to action for investors and ESG risk analysts
Fundamental ESG risk analysis must integrate climate scenarios into their frameworks. Professional investors should prioritise understanding the interplay between transitional and physical risks under varying climate scenarios. Of course, the equivalent should be done for transitional and physical nature risks, but here the methodology for scenarios is not well defined. Although water risk is part of the climate change risks, there may be good reasons to include more detailed scenarios for that too to capture industry, sector and company specific risks.
How the climate change scenario impacts ESG risk materiality
By adopting a nuanced and forward-looking perspective, ESG analysts can provide actionable insights to guide investment decisions ensuring long-term value creation and improved expected risk adjusted returns.
Understanding the type or scenario we are likely heading for is very important for the ESG risk materiality, as it will change from focussing on companies’ adverse impacts today to their resilience to coming physical cc costs as we move out on the IPCC cc scenario scale.
RCP 2.6 and ESG risk materiality
Companies and ESG risk analysts are today mainly focussing on companies’ adverse environmental impacts, where GHG emission is the most predominant. This is aligned with climate change scenarios close to RCP 2.6. But all other pollution is relevant, then more for nature change risks. Fundamental ESG analysts will not only look at KPIs measuring the historic performance, but they will also look into governance frameworks, policies and more important management systems and programs with actions well described and KPIed. All potentially contributing lowering the transitional cc costs and lowering the physical cc costs in the future. The SFDR’s environmental PAIs (Principal Adverse Impacts) all focus on this side.
RCP 8.5 and ESG risk materiality
Companies and ESG risk analysts are looking at how companies are preparing for physical cc costs, but to a much lesser degree and definitely not aligned with a climate change scenario like RCP 8.5. Companies do TCFD reporting and starting to do TNFD reporting, but how much does it weigh into the total ESG risk perspective? Likely not enough when we see ongoing political changes. The more we evolve to a rougher climate change scenario the more this will increase in focus. Insurance premiums will also be a pass way for this, but then as a transitional cc costs moving it closer in time.
Impossible to model?
Are we capable of calculating a severe climate change scenario like RCP 8.5? How would company DCFs be impacted and what will be the resulting performance on global stock exchanges? The most severe cc scenarios indicate breakdown of systems and so severe changes that maybe investing activities as we know them will be irrelevant?
Physical climate change adaptation and resilience – It is time to prepare!
As time is passing without the required regulatory or volunteer corporate action as described by IPCC, companies’ action to prepare for severe climate impacts will become a critical component of ESG risk assessments. This includes investments in climate resilience overall; climate change resilient assets, climate resilient supply chains, etc. with target to ensure a climate resilient business model.
Today, most ESG analysts and companies are focussing on the transition risk. It is time to switch more of the focus to the physical climate change risk.
Conclusion
Effectively navigating and understanding climate change scenarios is paramount for ESG risk analysts aiming to deliver robust, forward-looking risk assessments. As illustrated above, each scenario, ranging from RCP 2.6’s heavy emphasis on transitional costs to RCP 8.5’s grave physical climate impacts, shapes ESG risk materiality in distinct ways. Integrating these varied risks into financial and strategic planning requires not only diligent examination of near-term regulatory pressures but also a comprehensive appreciation of longer-term environmental shifts. By recognizing the time-horizon differences in transitional and physical risks, and how discount rates can mask the true scale of future threats, ESG risk analysts can guide more resilient corporate strategies.
Ultimately, the call to action is clear: companies and investors must evolve from a narrow focus on carbon metrics toward a holistic understanding of how climate change, in all its complexity, will influence profitability, supply chains, and the broader social and environmental ecosystems they depend on. Only by adopting scenario-based thinking and preparing for multiple eventualities can businesses ensure long-term value creation and safeguard against mounting climate risks.
Some issues that need to be worked on:
- The time horizon difference – As scientists talk about tipping points and levels of no return, thinking in NPV terms can be very dangerous for climate and nature change risks. A “not-so-fun” fact is that the higher interest rates are, the lower is the NPV of future adverse climate change costs.
- Only profitable ESG risk mitigation will happen on a voluntary basis by companies, so a waste of time to try to make them do anything else, it is better to focus on the following point…
- As companies do not fully understand their ESG risks, their base for deciding what is profitable ESG risk mitigation is flawed, here there is a lot of work to do, concentrate on this instead, by helping the companies to understand their risk.
- It is hard to estimate the value of the physical cc risk as it is very uncertain and further out in time, the same goes for the effect of current physical cc risk mitigating action.
*ESG – Environmental, Social and Governance